How much does a hitter's performance in April impact their production over the rest of their season?
We know that April showers bring May flowers. Does the same hold true in baseball? More broadly, do April slumps bring better production throughout the rest of the season? Or is the opposite true?
In order to investigate this question, I looked at data over the past three seasons. I wanted players who fit a fair enough sample size, so I included hitters with at least 200 plate appearances in the month of April (plus the few regular season games in March) between 2011-2013. Using OPS as a barometer, the following hitters performed the best to start the season.
| Player | PA | OPS |
|---|---|---|
| Lance Berkman | 218 | 1.078 |
| Ryan Braun | 308 | 1.055 |
| David Ortiz | 235 | 1.051 |
| Chris Davis | 206 | 1.029 |
| Matt Kemp | 326 | 1.022 |
| Miguel Cabrera | 331 | 1.012 |
| Travis Hafner | 244 | 0.993 |
| Joey Votto | 351 | 0.989 |
| Prince Fielder | 322 | 0.970 |
| Mike Napoli | 250 | 0.936 |
| League Average | 0.714 |
The eye test tells us that hitters who hit well in March/April also happen to be good hitters overall.
Now let's look at the worst hitters coming out of spring training.
| Player | PA | OPS |
|---|---|---|
| League Average | 0.714 | |
| Will Venable | 248 | 0.594 |
| Marlon Byrd | 265 | 0.593 |
| Marco Scutaro | 263 | 0.590 |
| Chone Figgins | 211 | 0.590 |
| J.J. Hardy | 226 | 0.579 |
| Miguel Olivo | 210 | 0.578 |
| Juan Pierre | 294 | 0.568 |
| Raul Ibanez | 222 | 0.559 |
| Cliff Pennington | 272 | 0.535 |
| Brendan Ryan | 240 | 0.472 |
Again, no name jumps off this list as an obvious anomaly.
The question thus becomes: How much does early season success translate into overall success? We know which players are the best and worst in March/April. How do the best and worst hitters throughout the entire year perform early in the season compared to their overall numbers?
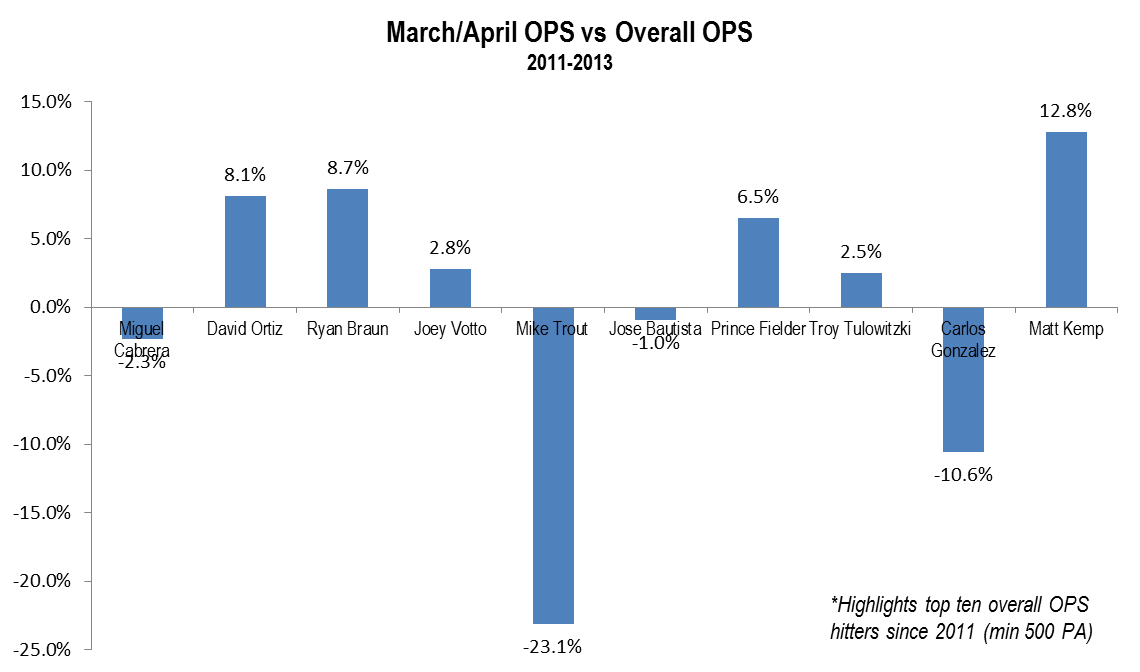
The chart below outlines the top 10 hitters in terms of OPS since 2011 (min 500 PA). As is evident, the superhuman, Mark Trout, has a relative weakness. He hits 23% below his overall OPS average in the months of March and April. As a group, however, only two players—Trout and Carlos Gonzalez—have significant negative differences in their early season success compared to their overall output. Four players—David Ortiz, Ryan Braun, Prince Fielder, and Matt Kemp— hit over 5% better in the season's earliest months. Overall, seven of the league's 10 best hitters during the past three seasons found the first month of the season to be a good one.
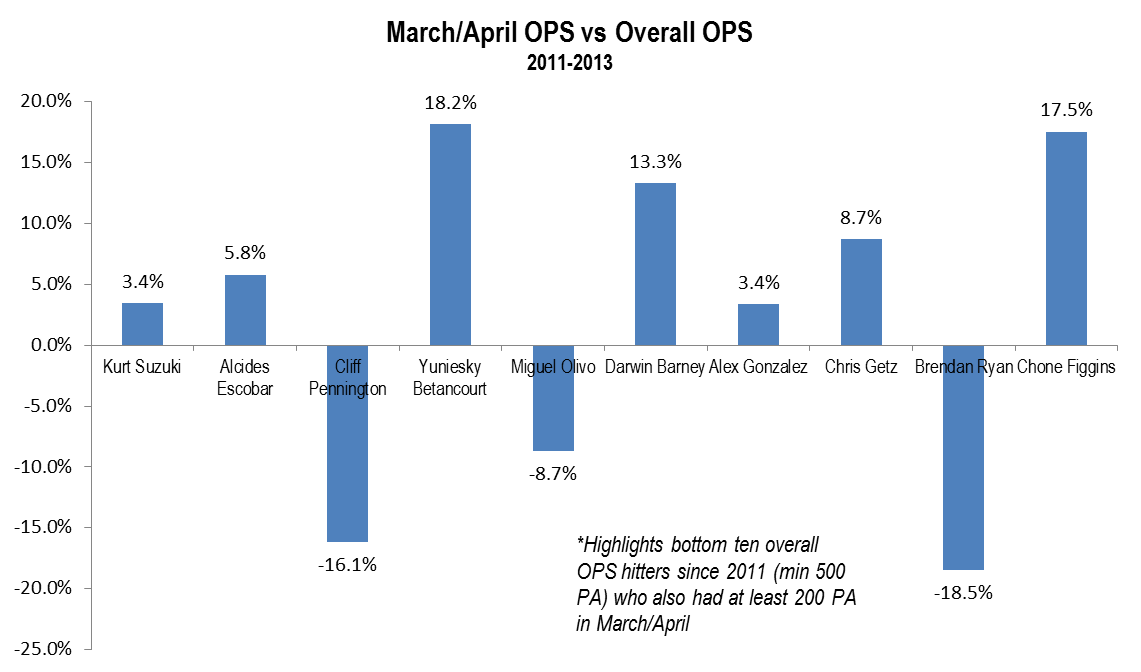
Let's take a look at the opposite view. In order to satisfy an appropriate sample size, these are the 10 worst OPS hitters between 2011-2013 who had at least 200 plate appearances in the months of March and April. As the chart clearly shows, seven of the 10 players listed batted better early in the season than they would for the entire season.
Are we finding a trend? The best hitters are more successful in April, as are the worst hitters. Ironically, that is the opposite of the league trend.
What does all this tell us? It is hard to say if April slumps bring bright seasons, because other than Mike Trout and Carlos Gonzalez, most of the top hitters in baseball perform as well, if not better, in April as they do overall. As for the opposite perspective—if April success can be followed by a terrible season—the evidence is just as inconclusive when focusing on some of the league's worst hitters. If anything, focusing on a small group of players, it seems that March/April are better months to hit in than league average makes us believe.
So rather than looking at the league's best and worst hitters, let's try to find our answer in a broader search. How many hitters perform significantly worse in March/April than they do the rest of the season? And not only that, but how many actually turn those dreadful starts into good seasons?
The chart above highlights the percent change in a player's overall OPS from their March/April performance. 53.5% of the players with at least 200 plate appearances between 2011-2013 in March/April saw their overall OPS improve from their early season numbers. And 5.8% saw significant improvement. The 10 players who collectively saw their April slumps turn into good (well, relatively good for Brendan Ryan) seasons are highlighted in the table below.
| Player | March/April | Overall | Difference |
|---|---|---|---|
| Raul Ibanez | 0.559 | 0.751 | 34.3% |
| Will Venable | 0.594 | 0.759 | 27.8% |
| Marco Scutaro | 0.590 | 0.751 | 27.3% |
| Giancarlo Stanton | 0.711 | 0.903 | 27.0% |
| Marlon Byrd | 0.593 | 0.750 | 26.5% |
| J.J. Hardy | 0.579 | 0.732 | 26.4% |
| Brendan Ryan | 0.472 | 0.579 | 22.7% |
| Pedro Alvarez | 0.602 | 0.738 | 22.6% |
| Andrew McCutchen | 0.734 | 0.895 | 21.9% |
| Albert Pujols | 0.703 | 0.853 | 21.3% |
Right away, we see some star players, like Albert Pujols, Giancarlo Stanton, and Andrew McCutchen. Of course, Pujols' numbers are skewed from his extremely slow start in Anaheim in 2012. The list shows that even the best in the game can have habitually bad starts, as all of these players did relative to their overall performance between 2011-2013, and still turn their season around.
Is there enough evidence to suggest that April slumps bring rest-of-the-season flowers? Not quite. But we can say that whether we look at the league's best hitters or worst hitters, as well as the distribution of all qualified hitters, there is not an exact trend, other than a slight edge towards a select few players who turn their slow April starts into brighter seasons.
. . .
All statistics courtesy of Baseball-Reference.
Jeffrey Bellone is a writer and editor at Beyond The Box Score and can also be found writing about the Mets at Amazin' Avenue and Mets Merized Online. He has his own blog, where he focuses on New York sports. at Over the Whitestone. You can follow and interact with him on Twitter @OverWhitestone.


