
While we await for MLB Advanced Media to provide us with the best quantitative data we have ever seen on fielding, we will rely on what scouts see to decide who makes the most difficult plays.
It has been only a week since the geeks of the baseball universe started salivating over the announcement by MLB Advanced Media that new very detailed data is on the horizon. Fielding statistics have improved over time, but true saber-slanted metrics on fielding are still in the shadows. New cameras by MLBAM will finally shine proper light on fielding performance by measuring everything from the speed at which a fielder accelerates to the distance he travels to make a catch.
While we wait for new and improved data, we can celebrate an old-school set of data introduced on FanGraphs earlier this week. Yes, saberfolks, this is subjective data from scouts using their natural senses to evaluate players. The horror! But we aren't completely close-minded here at Beyond the Box Score. In fact, quite the opposite. Too often baseball analysts get slotted into categories of either old-school or sabers. The best analysts understand how to be both (I suppose I just inflated my perception of myself).
Inside Edge is a company that tracks every pitch of every MLB game, with scouts measuring the difficulty of each ball in play. While the Inside Edge data is purely subjective, it is still a useful glimpse into how scouts view the defensive play of different players. What will be interesting in the future is comparing the subjective data that we have from scouts to the data provided from MLBAM. Will we one day be evaluating the effectiveness of scouts? Do their eyes see the truth?

Inside Edge fielding data is categorized into how easy or difficult it is for a particular fielder to successfully make a given play. If a shortstop has to cross over second base to make a diving stop and then throw out a speedy runner, that play would be categorized as much more difficult than a routine ground ball hit by a slow-footed baserunner. Each level of difficulty is slotted into the following bins:
| Difficulty | Scale |
|---|---|
| Impossible | 0% |
| Remote | 1-10% |
| Unlikely | 10-40% |
| About Even | 40-60% |
| Likely | 60-90% |
| Almost Certain / Certain | 90-100% |
As expected, impossible plays are, well, impossible, so while there may be opportunities to make the impossible happen, no fielder is actually capable of making those plays, and thus the scale starts at 0%. The next level of difficulty would be remote plays, and then the scale continues to the routine, almost certain plays.
It would be easy to pull the Inside Edge data from the FanGraphs leaderboard and analyze which players made the most difficult plays - as well as which couldn't make the easiest ones - but some context is needed. How does a player's position impact the type of plays that they see? As the chart below illustrates, some positions, like pitcher and particularly, catcher, face less routine plays than other positions. Over 50% of a catcher's fielding opportunities are considered remote or unlikely due to the fact that most of their fielding opportunities include throwing out a baserunner which is inherently a difficult task.
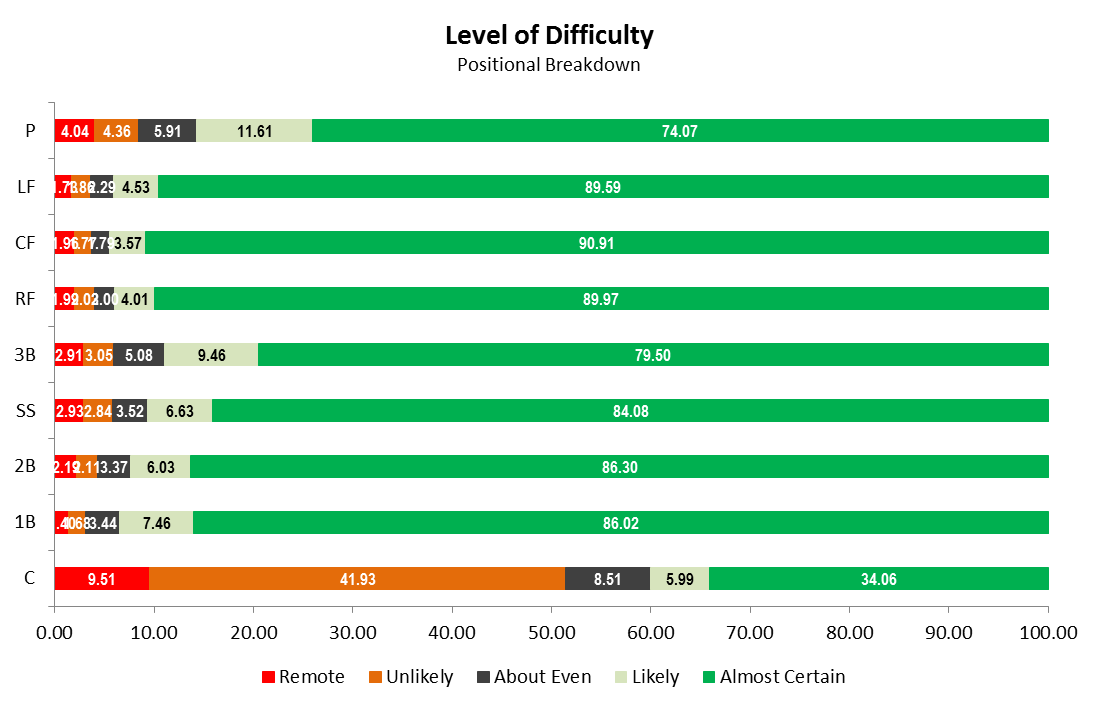
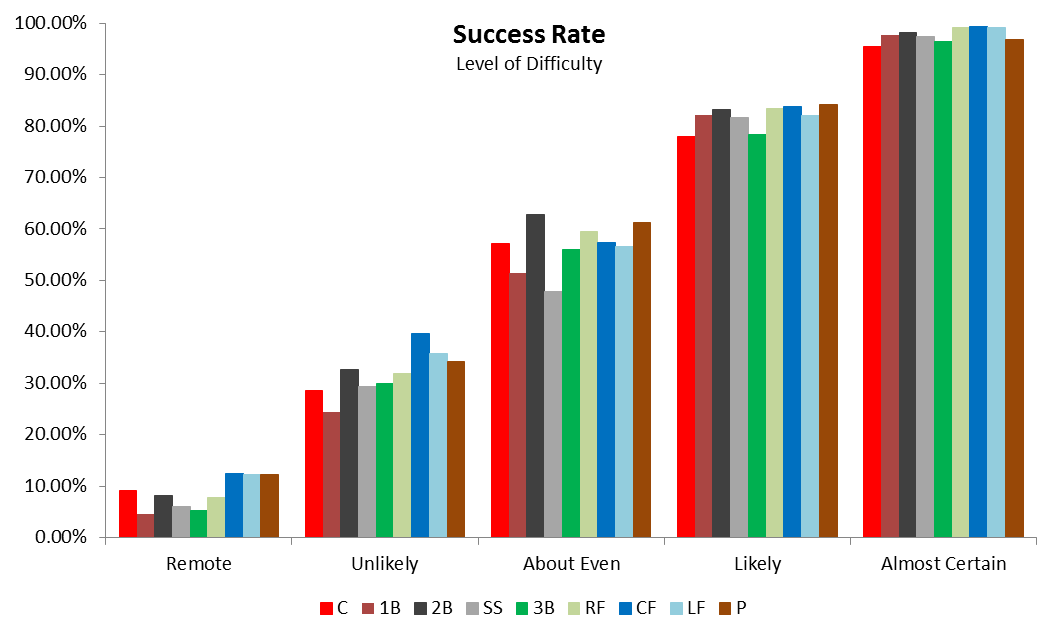
Of course, different positions face unique fielding challenges. The chart below shows the distribution in the type of plays made at each position. Catchers have the lowest success rate at almost certain plays (95.4%), but also have the fewest almost certain opportunities, with only 34.1% of defensive plays they see being almost certain. It makes sense that infielders, collectively, have to make tougher plays than outfielders. Overall, the mix in difficulty level can help explain the varying success rates by position (with less opportunities mistakes are magnified).
To have a better understanding of how one fielder stacks up against another who plays a different position, let's look at these numbers with a positional adjustment.
In order to take into account positional differences, I simply compared each player's success rate in the various difficulty situations to the league-average success rate for their position. For example, Manny Machado had a 87.5% success rate on about even plays in 2013. The league average for third baseman was 56% for such plays, so Machado got to over 30% more even - neither difficult nor easy - balls in play than average.
Having a positional adjustment, we can now ask, which players made the most difficult plays in 2013?*
| Name | Position | Remote Opps | Remote Success | Remote (Pos Adj) |
|---|---|---|---|---|
| Manny Machado | 3B | 13 | 23.10% | 17.90% |
| Adeiny Hechavarria | SS | 13 | 23.10% | 17.10% |
| Brandon Phillips | 2B | 12 | 25.00% | 16.80% |
| Brandon Crawford | SS | 24 | 20.80% | 14.80% |
| Alcides Escobar | SS | 10 | 20.00% | 14.00% |
*Player played at least 900 innings in field and saw at least 10 remote opportunities.
And the opposite question, which players had the most trouble with the easiest plays in 2013?*
| Name | Position | Almost Certain Opps | Almost Certain Success | Almost Certain (Pos Adj) |
|---|---|---|---|---|
| Ryan Zimmerman | 3B | 294 | 93.90% | -2.50% |
| Joey Votto | 1B | 266 | 95.50% | -2.20% |
| Pablo Sandoval | 3B | 226 | 94.30% | -2.10% |
| Mike Moustakas | 3B | 280 | 94.60% | -1.80% |
| Chris Johnson | 3B | 233 | 94.90% | -1.50% |
*Player played at least 900 innings in field and saw at least 200 almost certain opportunities.
Use the dashboard below to find how your favorite team fielded compared to league average at each position. All players with at least 900 innings fielded at a particular position are included.

. . .
All statistics courtesy of Fangraphs.
Jeffrey Bellone is a writer and editor at Beyond The Box Score and can also be found writing about the Mets at Amazin' Avenue. You can follow and interact with him on Twitter @OverWhitestone.