Taking a closer look at Ike Davis's propensity to get on base in the second half of the season.
SNY flashed a graphic during their first spring telecast on Friday, highlighting Ike Davis's on-base proficiency during the second half of 2013. Let's expand on their table a bit.
| Rk | Player | OBP | PA | HR | RBI | BA | SLG | OPS |
|---|---|---|---|---|---|---|---|---|
| 1 | Mike Trout | 0.479 | 290 | 12 | 38 | 0.324 | 0.543 | 1.023 |
| 2 | Ike Davis | 0.449 | 138 | 4 | 15 | 0.286 | 0.505 | 0.954 |
| 3 | Matt Holliday | 0.442 | 249 | 9 | 47 | 0.348 | 0.552 | 0.994 |
| 4 | Andrew McCutchen | 0.441 | 286 | 11 | 35 | 0.339 | 0.561 | 1.001 |
| 5 | Joey Votto | 0.438 | 297 | 9 | 31 | 0.284 | 0.467 | 0.905 |
What sticks out right away is the number of plate appearances. Ike was ranked second among an elite group of on-base hitters, but with nearly half of the plate appearances of the next top-ranked player.
Looking at a fuller sample size—the first half of last season—it isn't hard to imagine the opposite ranking to be true. Sure enough, Ike Davis had the 7th lowest OBP of hitters with at least 200 plate appearances during the first half of 2013.
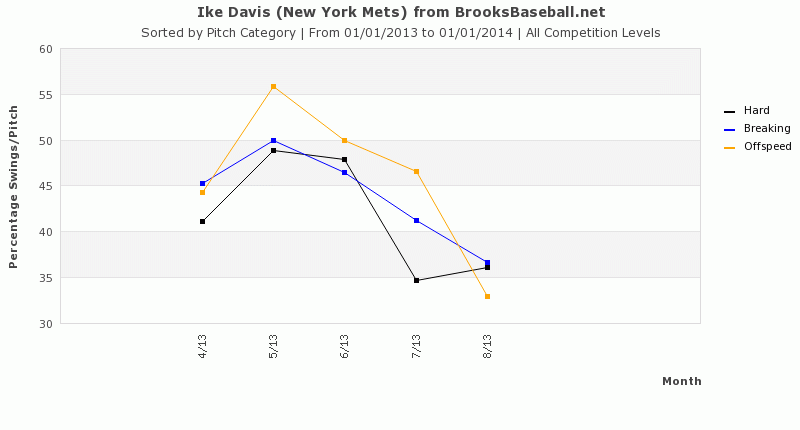
The question is what changes in the middle of the season that causes Ike to get on base more often? Looking at the chart below, we can clearly see that Ike was far less aggressive swinging the bat last season in July and August compared to April through June, particularly on hard (four-seam fastballs, sinkers, and cutters) pitches. By being more selective about which pitches he swung at, he walked more often. Between July and August, against hard pitches, Ike walked 1.7 times per every strikeout, compared to 0.7 walks per strikeout in the first half of the season.
Mets fans are often frustrated with the familiar scene of Ike taking a called third strike, and then standing in the box, arguing about it with the ump. Perhaps his less aggressive approach pays off in the long run.