You've probably heard a lot about park factors, but you might not know exactly what they are. Here's what you need to know.
Among most sports, baseball is unique in that the stadium in which the game is played has a tangible effect on the game itself. This can be attributed to the paucity of defined standards for a park's construction, for which there are many reasons. In a nutshell, many parks date to a time when standards didn't exist for anything, and by the time people realized that standardization would be advantageous, it was too unfeasible to actually be completed. Hence, thirty different ballparks.
![]() Must Reads
Must Reads ![]()
The fun part of this, for a statistically-inclined person such as myself, is that it gives us another angle of the game to analyze: park factors. For the sake of neutrality, we evaluate every player on an equal scale, which means that players are credited or debited for the park in which they play. All of the inherent benefits or costs of a particular stadium are boiled down into one simple number.
FanGraphs keeps track of these simple park factors for every year since 1871. The more complex ones, however, only go back to 1974, so our discussion will focus on those 40 years for now. As with many things statistical-y, 100 is the major-league average. In addition to the overall factors, FanGraphs provides figures for singles, doubles, triples, and home runs (each of these is also scaled to 100).
How well do these correlate to one another? As the following table shows, not particularly well:
| Overall | 1B | 2B | 3B | HR | |
|---|---|---|---|---|---|
| Overall | X | 0.379 | 0.426 | 0.178 | 0.446 |
| 1B | 0.379 | X | 0.061 | 0.053 | 0.045 |
| 2B | 0.426 | 0.061 | X | 0.246 | 0.023 |
| 3B | 0.178 | 0.053 | 0.246 | X | 0.009 |
| HR | 0.446 | 0.045 | 0.023 | 0.010 | X |
By using Pearson's r², we can measure the association between each of the variables. The strongest correlations to be found are between the overall park factors and the ones for doubles and home runs, but even they aren't all that significant -- a good r² for this would be in the .5 range. For the most part, these park factors seem to exist independent of one another. They're still fairly consistent, though:
| Overall | 1B | 2B | 3B | HR | |
|---|---|---|---|---|---|
| SD | 4.04 | 2.19 | 5.16 | 12.87 | 7.62 |
| YTY (r²) | 0.930 | 0.882 | 0.934 | 0.942 | 0.940 |
All five correlate extremely well year-to-year, and there isn't a whole ton of variation among them (except for triples).
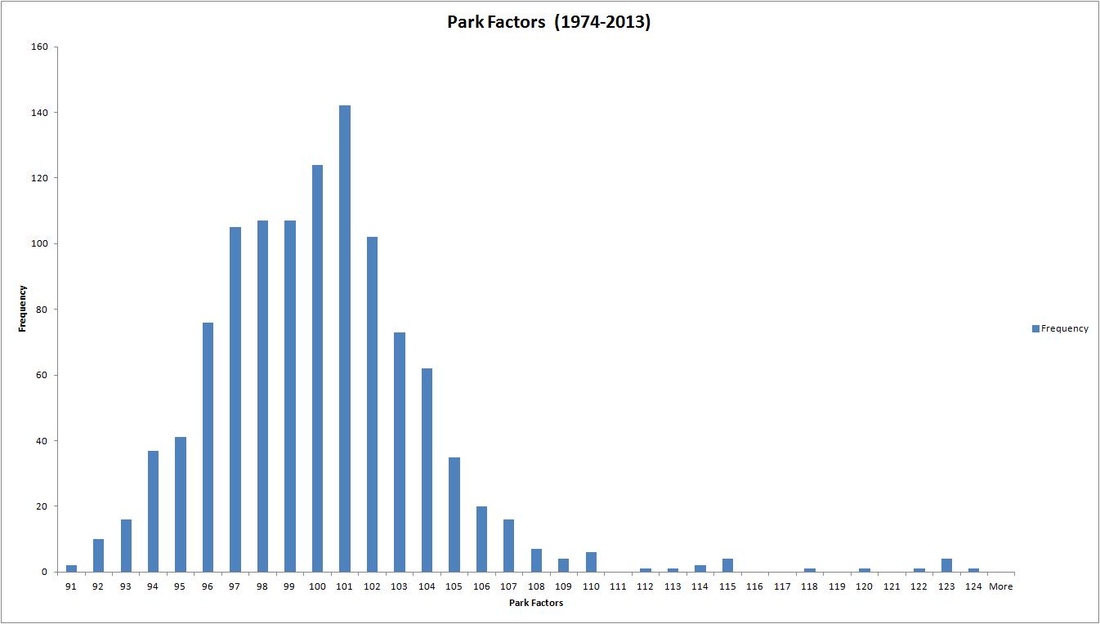
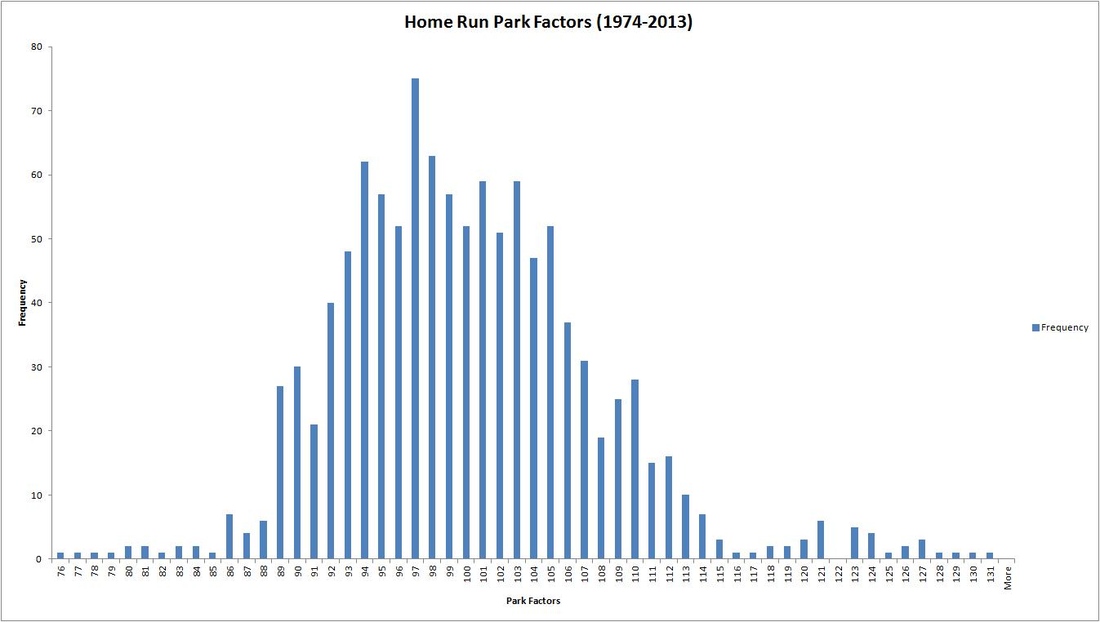
Now let's look at the individual figures. Each team has one per season (obviously), and since there have been 1108 team seasons in the past 40 years, there are 1108 of each park factor over that span as well. Looking at the histogram of overall park factors over the past 40 years, there's definitely a positive skew:
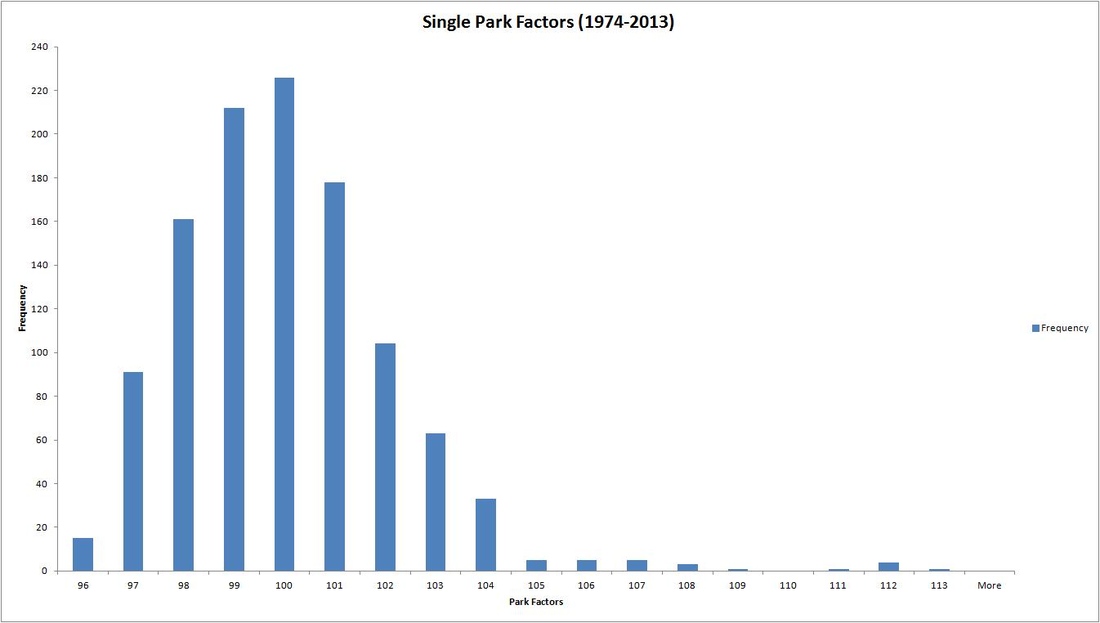
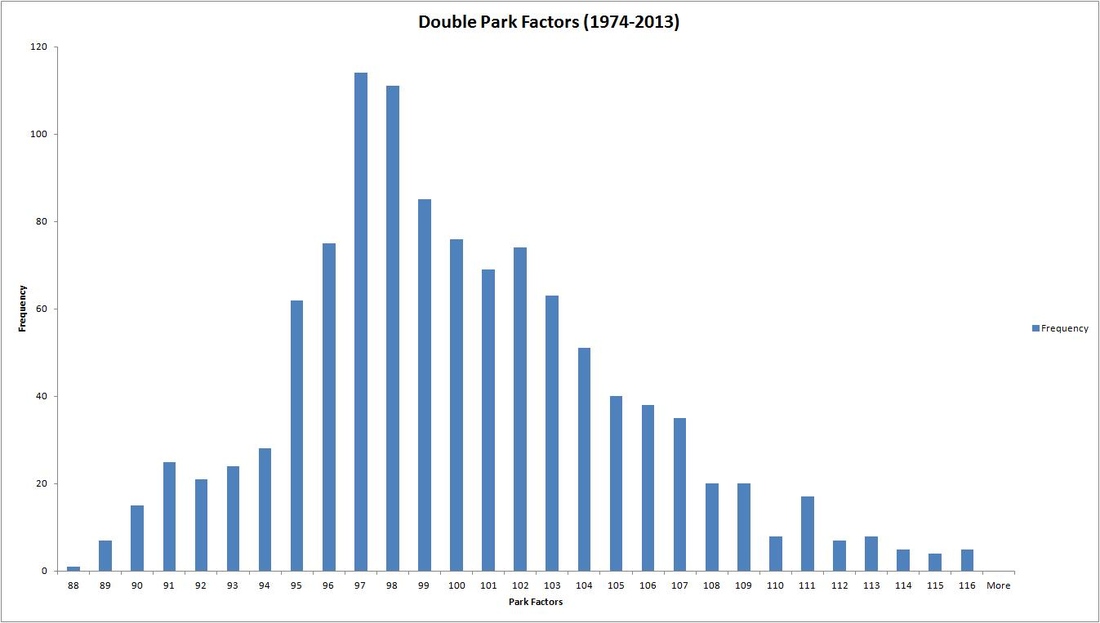
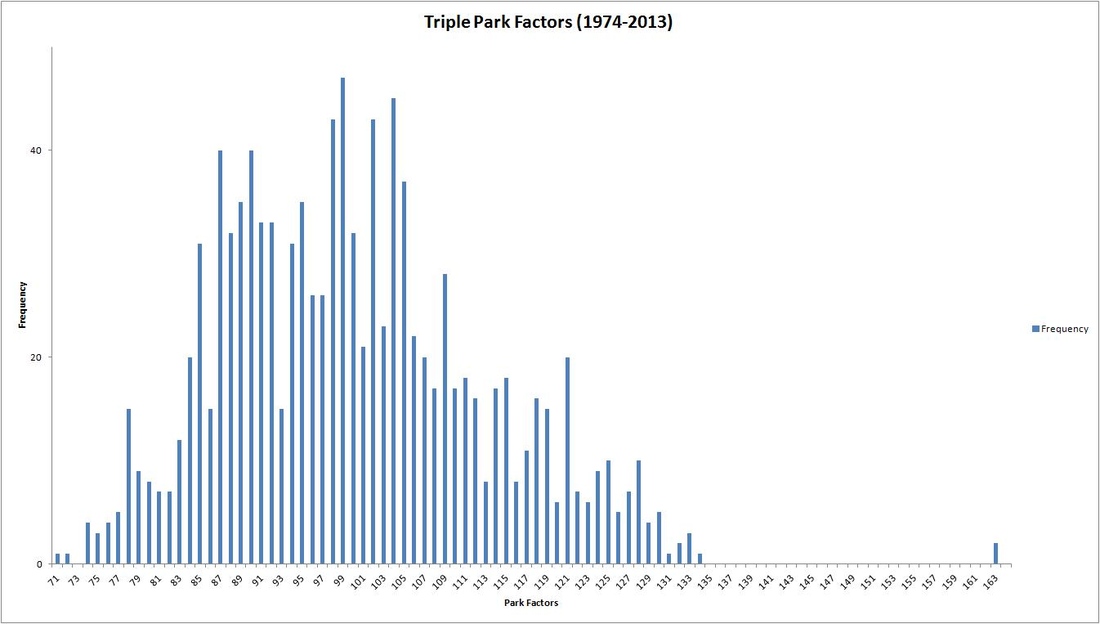
While the histograms for the other factors vary in their spread, they all share the same positivity, to varying extents:
As was mentioned earlier, the histogram for triples has the widest spread and the most modes by far, as triples aren't nearly as consistent year-to-year. Singles and doubles are fairly tightly distributed, and home runs are spread more finely, although they're much more unimodal than triples.
The aforementioned 1108 seasons occurred in 55* different ballparks. How do these compare to one another? Which favor the hitting-folk, and which are more inclined toward the ones who hurl?
*Well, 54 -- in 1974 and 1975, the Yankees and Mets shared Shea Stadium. It has different factors for each of them, though, so it's listed as two different parks.
| Field | Years Used | Overall (Average) | 1B (Average) | 2B (Average) | 3B (Average) | HR (Average) |
|---|---|---|---|---|---|---|
| Coors Field | 1995- | 116.1 | 108.5 | 108.8 | 124.7 | 117.1 |
| Mile High Stadium | 1993-1994 | 114 | 106 | 104 | 163 | 106 |
| Atlanta-Fulton County Stadium | 1974-1996 | 105.4 | 102.9 | 100.6 | 89.5 | 114.4 |
| Globe Life Park | 1994- | 104.7 | 102 | 102.2 | 116.7 | 105.2 |
| Chase Field | 1998- | 104.4 | 100.9 | 105.4 | 125.7 | 103.9 |
| Wrigley Field | 1974- | 104.2 | 101.6 | 100.8 | 98.6 | 109.7 |
| Fenway Park | 1974- | 104.1 | 101.9 | 112.3 | 101 | 99.3 |
| Jarry Park Stadium | 1974-1976 | 104 | 104 | 99 | 108 | 103 |
| Exhibition Stadium | 1977-1989 | 103.2 | 98.5 | 107.8 | 117.9 | 103.2 |
| Yankee Stadium (II) | 2009- | 103 | 100 | 97 | 84.8 | 110 |
| Metrodome | 1974-2009 | 102.1 | 100.5 | 103.5 | 111.6 | 99.8 |
| Kauffman Stadium | 1974- | 101.9 | 101.7 | 105.7 | 121.2 | 92.9 |
| Riverfront Stadium | 1974-2002 | 101.7 | 98.2 | 105.4 | 98.2 | 104.2 |
| Great American Ball Park | 2003- | 101.7 | 98.6 | 99.3 | 90.4 | 110.4 |
| Kingdome | 1977-1999 | 101.4 | 98 | 103.6 | 95 | 110.1 |
| Citizens Bank Park | 2004- | 101.4 | 99.4 | 99.8 | 94.4 | 106.1 |
| Rogers Centre | 1990- | 101.2 | 98 | 104 | 106.2 | 104.2 |
| Comiskey Park | 1974-1990 | 101.1 | 100.4 | 99.1 | 116.7 | 93.9 |
| Veterans Stadium | 1974-2003 | 101.1 | 98.1 | 104.7 | 107.6 | 101.1 |
| Marlins Park | 2012- | 101 | 101 | 101 | 109 | 89 |
| U.S. Cellular Field | 1991- | 100.8 | 99.1 | 97 | 93.9 | 105.9 |
| Tiger Stadium | 1974-1999 | 100.7 | 98 | 95.6 | 99.5 | 108.6 |
| Cleveland Stadium | 1974-1993 | 100.7 | 102 | 97.4 | 91.8 | 100.6 |
| Three Rivers Stadium | 1974-2000 | 100.6 | 99.1 | 102.8 | 102.7 | 100.4 |
| Minute Maid Park | 2000- | 100.4 | 99.6 | 98.7 | 108.6 | 104.5 |
| Miller Park | 2001- | 100.1 | 97.2 | 100.2 | 100 | 104.8 |
| Olympic Stadium | 1977-2004 | 100 | 98.5 | 104.5 | 103 | 96 |
| Target Field | 2010- | 100 | 101 | 101 | 109 | 93 |
| Nationals Park | 2008- | 100 | 101.5 | 101 | 97 | 99.5 |
| Camden Yards | 1992- | 99.8 | 101.1 | 95.8 | 87.8 | 104.9 |
| Comerica Park | 2000- | 99.6 | 101.9 | 96.9 | 119.1 | 96.6 |
| Arlington Stadium | 1974-1993 | 99.6 | 101.3 | 98.2 | 94.6 | 98.7 |
| Milwaukee County Stadium | 1974-2000 | 99.4 | 101 | 98.1 | 99.5 | 95.2 |
| Busch Stadium (II) | 1974-2005 | 99.4 | 99.9 | 101.7 | 107 | 93.9 |
| Progressive Field | 1994- | 99.2 | 100.4 | 101.1 | 87.9 | 97.2 |
| Turner Field | 1997- | 99.1 | 100.5 | 97.9 | 97.6 | 97.7 |
| PNC Park | 2001- | 98.6 | 101.7 | 102.9 | 93.8 | 93.2 |
| Angel Stadium of Anaheim | 1974- | 98.3 | 100.5 | 96.6 | 86 | 100.7 |
| Yankee Stadium (I) | 1976-2008 | 98.2 | 99.7 | 96.6 | 93.1 | 100.1 |
| Shea Stadium (Yankees) | 1974-1975 | 98 | 98 | 101 | 97 | 97 |
| Tropicana Field | 1998- | 97.9 | 99.1 | 98.4 | 108.7 | 97.9 |
| Sun Life Stadium | 1993-2011 | 97.9 | 99.2 | 97.8 | 109.6 | 95.1 |
| Candlestick Park | 1974-1999 | 97.5 | 98.7 | 97.5 | 94.7 | 96.8 |
| AT&T Park | 2000- | 97.2 | 100.4 | 100.1 | 111.6 | 90.7 |
| Busch Stadium (III) | 2006- | 97 | 100.5 | 96.9 | 92.5 | 91.9 |
| Shea Stadium (Mets) | 1974-2008 | 96.9 | 99.6 | 96.9 | 91.9 | 97.2 |
| Memorial Stadium | 1974-1991 | 96.8 | 98.1 | 96.9 | 80.7 | 99.2 |
| Citi Field | 2009- | 96.6 | 98.2 | 95.8 | 101 | 97 |
| O.co Coliseum | 1974- | 96.2 | 98.6 | 94.5 | 91.3 | 95.9 |
| Qualcomm Stadium | 1974-2003 | 96.1 | 99 | 94.1 | 96.4 | 99.7 |
| RFK Memorial Stadium | 2005-2007 | 96 | 98 | 98 | 102 | 91 |
| Safeco Field | 2000- | 95.7 | 98.4 | 95.9 | 88.3 | 95.2 |
| Dodger Stadium | 1974- | 95.7 | 100.5 | 91.9 | 78.5 | 98.1 |
| Astrodome | 1974-1999 | 94.7 | 98.6 | 98.8 | 105.3 | 84.8 |
| Petco Park | 2004- | 92.1 | 96.9 | 91.5 | 104.4 | 90.6 |
Obviously, some parks (Colorado, Texas) favor scoring, while others (San Diego, Los Angeles) don't. Some confirm their reputations, others don't -- as an Orioles fan, Camden Yards' 99.8 overall factor was pretty surprising.
How about the consistency of each park from year to year?
| Field | Years Used | Overall YTY | 1B YTY | 2B YTY | 3B YTY | HR YTY |
|---|---|---|---|---|---|---|
| Comerica Park | 2000- | 0.921 | 0.660 | 0.842 | 0.586 | 0.889 |
| Coors Field | 1995- | 0.905 | 0.881 | 0.653 | 0.502 | 0.892 |
| U.S. Cellular Field | 1991- | 0.901 | 0.438 | 0.516 | 0.875 | 0.942 |
| Minute Maid Park | 2000- | 0.890 | 0.266 | 0.378 | 0.611 | 0.300 |
| Tropicana Field | 1998- | 0.870 | 0.762 | 0.914 | 0.010 | 0.419 |
| Wrigley Field | 1974- | 0.868 | 0.714 | 0.727 | 0.727 | 0.879 |
| Qualcomm Stadium | 1974-2003 | 0.864 | 0.413 | 0.739 | 0.332 | 0.913 |
| Camden Yards | 1992- | 0.842 | 0.640 | 0.885 | 0.544 | 0.875 |
| Sun Life Stadium | 1993-2011 | 0.836 | 0.624 | 0.827 | 0.757 | 0.585 |
| Tiger Stadium | 1974-1999 | 0.825 | 0.760 | 0.879 | 0.892 | 0.472 |
| Metrodome | 1974-2009 | 0.817 | 0.562 | 0.734 | 0.644 | 0.812 |
| Fenway Park | 1974- | 0.817 | 0.705 | 0.820 | 0.550 | 0.897 |
| Progressive Field | 1994- | 0.753 | 0.660 | 0.538 | 0.735 | 0.662 |
| AT&T Park | 2000- | 0.748 | 0.361 | 0.557 | 0.834 | 0.714 |
| Memorial Stadium | 1974-1991 | 0.744 | 0.788 | 0.507 | 0.613 | 0.868 |
| Exhibition Stadium | 1977-1989 | 0.715 | 0.737 | 0.745 | 0.627 | 0.111 |
| O.co Coliseum | 1974- | 0.714 | 0.529 | 0.892 | 0.840 | 0.790 |
| Candlestick Park | 1974-1999 | 0.705 | 0.565 | 0.686 | 0.932 | 0.829 |
| Atlanta-Fulton County Stadium | 1974-1996 | 0.703 | 0.446 | 0.711 | 0.758 | 0.916 |
| Dodger Stadium | 1974- | 0.693 | 0.853 | 0.880 | 0.698 | 0.827 |
| Riverfront Stadium | 1974-2002 | 0.691 | 0.670 | 0.711 | 0.769 | 0.660 |
| Kauffman Stadium | 1974- | 0.680 | 0.824 | 0.774 | 0.850 | 0.897 |
| Angel Stadium of Anaheim | 1974- | 0.671 | 0.596 | 0.763 | 0.685 | 0.881 |
| PNC Park | 2001- | 0.660 | 0.350 | 0.860 | 0.407 | 0.798 |
| Three Rivers Stadium | 1974-2000 | 0.652 | 0.750 | 0.466 | 0.375 | 0.684 |
| Rogers Centre | 1990- | 0.603 | 0.446 | 0.614 | 0.700 | 0.784 |
| Milwaukee County Stadium | 1974-2000 | 0.593 | 0.655 | 0.488 | 0.565 | 0.567 |
| Arlington Stadium | 1974-1993 | 0.551 | 0.758 | 0.532 | 0.883 | 0.786 |
| Chase Field | 1998- | 0.528 | 0.325 | 0.596 | 0.311 | 0.605 |
| Globe Life Park | 1994- | 0.513 | 0.682 | 0.653 | 0.258 | 0.664 |
| Veterans Stadium | 1974-2003 | 0.512 | 0.625 | 0.511 | 0.575 | 0.811 |
| Astrodome | 1974-1999 | 0.510 | 0.840 | 0.740 | 0.634 | 0.848 |
| Yankee Stadium (I) | 1976-2008 | 0.479 | 0.440 | 0.369 | 0.922 | 0.781 |
| Kingdome | 1977-1999 | 0.479 | 0.493 | 0.394 | 0.815 | 0.900 |
| Shea Stadium (Mets) | 1974-2008 | 0.462 | 0.527 | 0.423 | 0.775 | 0.759 |
| Olympic Stadium | 1977-2004 | 0.435 | 0.393 | 0.486 | 0.682 | 0.831 |
| Comiskey Park | 1974-1990 | 0.403 | 0.723 | 0.257 | 0.766 | 0.608 |
| Busch Stadium (II) | 1974-2005 | 0.393 | 0.688 | 0.730 | 0.922 | 0.804 |
| Miller Park | 2001- | 0.386 | 0.441 | 0.288 | 0.016 | 0.727 |
| Great American Ball Park | 2003- | 0.340 | 0.643 | 0.413 | 0.904 | 0.614 |
| Citi Field | 2009- | 0.333 | 0.333 | 0.333 | 0.333 | 0.333 |
| Cleveland Stadium | 1974-1993 | 0.229 | 0.780 | 0.715 | 0.676 | 0.708 |
| Citizens Bank Park | 2004- | 0.190 | 0.654 | 0.527 | 0.391 | 0.610 |
| Petco Park | 2004- | 0.003 | 0.135 | 0.521 | 0.257 | 0.096 |
| Safeco Field | 2000- | 0.0004 | 0.252 | 0.006 | 0.026 | 0.169 |
| Turner Field | 1997- | 0.0002 | 0.397 | 0.019 | 0.268 | 0.198 |
| Busch Stadium (III) | 2006- | X | 0.563 | 0.028 | 0.832 | 0.028 |
| Marlins Park | 2012- | X | X | X | X | X |
| Jarry Park Stadium | 1974-1976 | X | X | X | X | X |
| Nationals Park | 2008- | X | 0.444 | X | 0.444 | 0.444 |
| Mile High Stadium | 1993-1994 | X | X | X | X | X |
| Target Field | 2010- | X | X | X | X | X |
| Shea Stadium (Yankees) | 1974-1975 | X | X | X | X | X |
| Yankee Stadium (II) | 2009- | X | X | X | X | X |
| RFK Memorial Stadium | 2005-2007 | X | X | X | X | X |
(Note: Some ballparks have the "X"; this is because the park factor for them has been the same forever, as they haven't [or didn't] exist enough to have variation.)
For each stadium, there's a different level of constancy for each factor. Moreover, the amount of cohesive factors varies -- Candlestick stays pretty steady across the board, while Safeco is inharmonious on every level.
Lastly, how consistent are they as a whole?
| Field | Years Used | Overall SD | 1B SD | 2B SD | 3B SD | HR SD |
|---|---|---|---|---|---|---|
| Coors Field | 1995- | 5.59 | 2.64 | 1.60 | 4.05 | 7.17 |
| Wrigley Field | 1974- | 3.24 | 1.82 | 2.90 | 4.89 | 7.18 |
| U.S. Cellular Field | 1991- | 3.08 | 0.740 | 1.67 | 7.10 | 7.67 |
| Qualcomm Stadium | 1974-2003 | 2.69 | 1.20 | 1.78 | 3.82 | 8.82 |
| Camden Yards | 1992- | 2.39 | 1.18 | 3.16 | 3.36 | 3.43 |
| Atlanta-Fulton County Stadium | 1974-1996 | 2.39 | 1.23 | 2.28 | 4.95 | 9.61 |
| AT&T Park | 2000- | 2.37 | 1.11 | 1.22 | 7.43 | 1.98 |
| Candlestick Park | 1974-1999 | 2.34 | 1.17 | 2.10 | 11.29 | 4.07 |
| Tiger Stadium | 1974-1999 | 2.26 | 1.18 | 3.72 | 6.42 | 2.32 |
| Tropicana Field | 1998- | 2.25 | 0.99 | 3.22 | 1.96 | 1.89 |
| Comerica Park | 2000- | 2.22 | 0.88 | 2.47 | 5.90 | 4.19 |
| Milwaukee County Stadium | 1974-2000 | 2.18 | 1.54 | 2.21 | 3.49 | 1.88 |
| Minute Maid Park | 2000- | 2.16 | 0.73 | 1.28 | 6.53 | 0.50 |
| Progressive Field | 1994- | 2.10 | 1.28 | 1.09 | 5.51 | 3.23 |
| Fenway Park | 1974- | 2.02 | 1.26 | 2.80 | 3.62 | 5.33 |
| Sun Life Stadium | 1993-2011 | 1.96 | 1.10 | 2.50 | 4.68 | 1.94 |
| Metrodome | 1974-2009 | 1.92 | 0.90 | 4.69 | 6.17 | 3.17 |
| Angel Stadium of Anaheim | 1974- | 1.86 | 1.02 | 2.40 | 4.10 | 5.23 |
| Three Rivers Stadium | 1974-2000 | 1.85 | 1.20 | 1.20 | 2.93 | 3.35 |
| Olympic Stadium | 1977-2004 | 1.84 | 0.73 | 1.88 | 5.59 | 4.08 |
| Memorial Stadium | 1974-1991 | 1.80 | 0.99 | 1.43 | 3.06 | 4.06 |
| Kauffman Stadium | 1974- | 1.80 | 1.61 | 3.47 | 8.84 | 5.75 |
| Dodger Stadium | 1974- | 1.77 | 2.14 | 2.92 | 3.96 | 4.41 |
| Kingdome | 1977-1999 | 1.74 | 0.91 | 3.39 | 5.53 | 8.73 |
| Exhibition Stadium | 1977-1989 | 1.66 | 1.28 | 2.63 | 5.70 | 2.32 |
| O.co Coliseum | 1974- | 1.60 | 0.89 | 3.15 | 5.89 | 2.96 |
| Safeco Field | 2000- | 1.53 | 1.11 | 2.31 | 1.62 | 1.90 |
| Veterans Stadium | 1974-2003 | 1.49 | 0.92 | 1.81 | 4.92 | 3.01 |
| Yankee Stadium (I) | 1976-2008 | 1.49 | 0.82 | 1.39 | 8.84 | 3.32 |
| Riverfront Stadium | 1974-2002 | 1.47 | 1.50 | 2.60 | 7.26 | 4.17 |
| Arlington Stadium | 1974-1993 | 1.47 | 1.37 | 1.47 | 8.03 | 4.10 |
| Globe Life Park | 1994- | 1.39 | 0.67 | 1.33 | 5.62 | 2.79 |
| Astrodome | 1974-1999 | 1.39 | 1.55 | 2.06 | 7.24 | 4.66 |
| Chase Field | 1998- | 1.32 | 0.70 | 1.37 | 3.49 | 2.18 |
| Comiskey Park | 1974-1990 | 1.28 | 1.03 | 1.32 | 4.61 | 3.06 |
| PNC Park | 2001- | 1.21 | 0.82 | 1.94 | 1.56 | 1.92 |
| Shea Stadium (Mets) | 1974-2008 | 1.18 | 1.20 | 1.36 | 5.45 | 2.47 |
| Busch Stadium (II) | 1974-2005 | 1.17 | 1.07 | 2.00 | 13.11 | 3.97 |
| Rogers Centre | 1990- | 1.11 | 0.84 | 1.97 | 7.92 | 3.41 |
| Petco Park | 2004- | 1.04 | 0.54 | 1.57 | 2.33 | 2.54 |
| Great American Ball Park | 2003- | 0.98 | 0.46 | 1.40 | 8.03 | 1.20 |
| Cleveland Stadium | 1974-1993 | 0.91 | 1.32 | 1.42 | 3.03 | 4.10 |
| Citizens Bank Park | 2004- | 0.80 | 1.02 | 0.87 | 2.01 | 2.26 |
| Miller Park | 2001- | 0.73 | 0.77 | 0.66 | 2.54 | 3.14 |
| Turner Field | 1997- | 0.54 | 0.50 | 1.08 | 1.85 | 0.75 |
| Citi Field | 2009- | 0.49 | 0.98 | 1.47 | 9.80 | 4.90 |
| Busch Stadium (III) | 2006- | 0 | 0.50 | 0.33 | 2.18 | 0.33 |
| Marlins Park | 2012- | 0 | 0 | 0 | 0 | 0 |
| Jarry Park Stadium | 1974-1976 | 0 | 0 | 0 | 0 | 0 |
| Nationals Park | 2008- | 0 | 0.50 | 0 | 2.00 | 0.50 |
| Mile High Stadium | 1993-1994 | 0 | 0 | 0 | 0 | 0 |
| Target Field | 2010- | 0 | 0 | 0 | 0 | 0 |
| Shea Stadium (Yankees) | 1974-1975 | 0 | 0 | 0 | 0 | 0 |
| Yankee Stadium (II) | 2009- | 0 | 0 | 0 | 0.43 | 0 |
| RFK Memorial Stadium | 2005-2007 | 0 | 0 | 0 | 0 | 0 |
Like for the aggregate figures, the Triples are more inconsistent than any of the other factors. Some parks don't even have standard deviations, and those that do differ wildly. For the most part, the highest deviations seem to go to parks that are hitter-friendly in that area, and vice versa.
So, there's a lot to learn about park factors, and the best part? This is all subject to change! That's right -- the 3-year regression that FanGraphs uses to derive their park factors means that all of this data will probably be worthless by this time next year. Until then, though, you've probably learned something; at least I have.
. . .
All statistics courtesy of FanGraphs.
Ryan Romano writes for Beyond the Box Score, the FanGraphs Community blog, and Camden Chat that one time. Follow him on Twitter at @triple_r_ if you enjoy angry tweets about Maryland sports and live tweeting about Community, Thursdays at 8/7c after the Olympics. Cool. Coolcoolcool.

